Research

Taking on Patent Trolls in the States

We are pleased to announce the latest paper from students at the Juelsgaard Intellectual Property and Innovation Clinic at Stanford Law School: “How States Can Fight Patent Trolls.”

Some context: the patent troll problem has gotten so bad that states are trying to come up with their own legislative fixes that fall within their jurisdiction.

This paper, by Marta Belcher, John Casey, Madeleine Laupheimer, and Brian Weissenberg, takes a comprehensive look across legislation passed by states to target patent trolls. They compare the provisions, the type of behavior the bills try to limit, modes of enforcement, as well as remedies and exemptions. The paper then goes on to analyze lawsuits brought by various state attorneys general under consumer protection laws and based on the outcomes, makes recommendations for lawsuits going forward.

These efforts at the state level highlight the need to address the patent troll problem, but state legislation can only do so much. The authors conclude, “Because bad faith must be asserted in order to avoid a state law cause of action being preempted by federal law, states can only really fight the egregious trolls that explicitly lie in their letters. In order to fully address the patent troll problem—a multidimensional problem of which frivolous demand letters make up only part—Congress must act.”

Report on Impact of Copyright Law on Investment


Engine, Fifth Era Release Report on Impact of Copyright Law on Investment

89% of investors said legal environment makes them less likely to invest

Engine and Fifth Era, an advisory and investment firm, today released a new report entitled "The Impact of Internet Regulation on Early Stage Investment". The report makes a compelling case for copyright reform, and will be used by Engine and other advocates to push Congress to enact reform legislation this session.

In 2014, Fifth Era surveyed 330 investors in eight countries around the world (Australia, France, Germany, India, Italy, Spain, the UK and the US) to assess the degree to which future legal environment might impact their willingness to invest in Digital Content Intermediaries (DCIs). These countries represent 56% of world GDP and 25 %of world population.

The survey found significant concerns among investors in all eight countries around a number of issues, including:

  • Legal Environment - Globally investors view the legal environment as having the most negative impact on their investing activities with 89% of the investors surveyed saying it had a modest or strongly negative impact. A large majority of early stage investors around the world feel that the current legal environment has a more negative impact on their investing than either a weak economy or an increased competitive environment.
  • Regulatory Ambiguity - When asked what it was about the legal environment that so concerns investors and impacts their investing behavior, the ambiguity in the current regulatory environment was identified as of significant concern. 88% of worldwide investors surveyed said they are uncomfortable investing in DCIs that offer user generated music and video given an ambiguous regulatory framework.
  • Uncertain and Potentially Large Damages - In all eight countries surveyed, early stage investors view the risk of uncertain and potentially large damages as of significant concern as they look to invest in DCIs. 85% agree or strongly agree that this is a major factor in making them uncomfortable about investing in DCIs.
  • Secondary Effects of IP Infringement Regulations - The second area of consistent concern worldwide was secondary liability. 78% of investors said they would be deterred from investing in DCI’s that offer user uploaded music or video should new anti-piracy regulations increase the risk that their investments would be exposed to secondary liability in IP infringement cases.
  • These findings highlight the risk that problematic copyright regulations might greatly curtail or cut off capital from the early stage companies that are driving global innovation, GDP growth and new job formation.

The full report can be found at:

http://www.fifthera.com/perspectives-blog/2015/3/20/6enku92k815grtyz9vfpmn83lqhfsx


Congressional Hearing Highlights Troubling Practices at the Patent Office

IP1.jpg

Bad patents hurt innovation. This is especially true when they end up in the hands of patent trolls, who often use them indiscriminately to extort settlement payments. While we are glad to hear the Patent Office (PTO) has been increasing its efforts to improve the patent examination process and, in turn, patent quality, a recent government oversight hearing in Congress on telework abuse brought to light several PTO management practices that can’t help but hurt progress toward increased patent quality.

Some background on the joint House Judiciary and Oversight hearing: The PTO has long been recognized as a leader in telework, allowing employees the flexibility to work from home, and has leveraged it recruit and retain examiners. A few years ago, serious allegations surfaced regarding time and attendance fraud and ineffective oversight regarding the telework program. In response, the PTO conducted an internal investigation and issued a report in July 2013. Unfortunately, that report was considerably watered down from a more critical draft report, which—perhaps not surprisingly—was never released.

At the hearing, Oversight Chairman Issa, who has a few dozen patents of his own, emphasized the importance of patent quality; he even joked that he was sure some of his patents were invalid. Judiciary Chairman Goodlatte and Congressmen Connelly and Cummings zeroed in on PTO practices that hinder quality, and called for a reassessment of performance metrics to ensure that quality is not sacrificed to quantity. We couldn’t agree more.

Chairman Goodlatte and others expressed concerns about the examiner “count system,” which creates a series of incentives for examiners, essentially giving them credit for accomplishing certain tasks, e.g., approving a patent application. The count system is often criticized for pushing examiners to not give patent applications the time they really deserve and, as a result, issue unworthy patents. There have been efforts to reform the count system, however any real change has gotten mired in negotiations with the Patent Office Professional Association, otherwise known as the Patent Examiners Union.

Another issue that came up was "end-loading” of work by examiners at the tail end of each quarter and how that practice undermines quality. Supervisors, who have limited time to review the quarter’s work, cannot effectively monitor the quality of work submitted when it comes in a flood of end-of-quarter submissions. Apparently, the practice is rampant. At the hearing, PTO representatives reported that they were in discussions with the Union to address end-loading, but no details were provided as to how or when that would happen.

The patent system in this country is not working, and startups and small inventors, faced with a growing patent troll problem, shoulder the resulting costs. As Congress and the courts work to fix the problem, the Patent Office, too, must do its part. The mismanagement that came to light during the recent congressional hearing leads directly to more low-quality patents, which are a patent troll’s favorite weapon.

The good news is that President Obama recently nominated Michelle Lee to direct the Patent and Trademark Office. Michelle Lee, who currently acts as the agency’s deputy director, would not only be the first woman and first minority to hold that post, but she has a background rare in a long lineage of PTO directors: a patent lawyer from Silicon Valley who has worked for and at companies who operate in the software space. For all these reasons, and more, we strongly support Michelle’s nomination, and recently said so in a letter to Senators Leahy and Grassley.

We’re hopeful that under strong leadership, the PTO can clean up the problems that plague it and, in turn, return to its core mission of issuing patents that actually incentivize innovation instead of hindering it.


Engine and R Street Release Study of Ridesharing Regulations

Fast-lanes.jpg

Few startup innovations in the past few years have been as influential and controversial as ridesharing technologies. The emergence and explosive growth of companies like Uber, Lyft, and Sidecar signaled the rise of the sharing economy, allowing virtually anybody to put their spare time, spare car, or spare room to productive use. Not surprisingly, incumbents operating in the markets that these new startups shook up have reacted strongly to their new competitors. Taxi interests in particular have fought hard against transportation networking companies (TNCs), lobbying for restrictions on their operation, and even getting cities to ban their operation entirely.

Regulators will always have a hard time keeping pace with the development of new technologies, but we believe that the great consumer value of TNCs and other sharing economy services warrants a balanced approach between promoting competition and protecting legitimate public health and safety concerns. To better figure out which cities were doing the best and worst to foster competition and innovation in transportation markets, Engine, in partnership with R Street Institute, released a report ranking US cities on how friendly their regulatory climate is towards ridesharing.

The study shows a wide range of regulatory approaches to ridesharing, with some cities like Portland banning them outright, and some like Washington D.C. creating a specific regulatory framework for TNCs that allows them to operate in the city under rules designed for their particular concerns. With this paper, citizens can learn more about what their representatives are doing to promote healthy transportation markets in their cities and figure out what other cities are doing right or wrong to encourage innovative startup activity in the transportation sector.

Along with the paper, R Street launched an associated website that maps out the cities in the study along with their grades and provides tools for citizens to ask their representatives to enact better TNC regulations.

The recent debate about how to treat ridesharing companies is a great case study for how startups can have a quick and meaningful impact on a city’s quality of life and how regulations have a hard time keeping up with the pace of innovation. With this paper, we hope that policymakers can learn about what works and what doesn’t when it comes to regulating the sharing economy.

Hacking the Patent System

IP.jpg

See the new white paper.

For many startups, the patent system is a necessary evil. Getting a patent can easily cost tens of thousands of dollars, and getting sued by a patent troll can cost millions. Despite these costs, and the other lost resources that come with them (lost employee and engineer time, stress, etc.), many startups find themselves feeling like it’s good business to file for patents. Traditionally, this was for a couple of reasons: 1) to use defensively if another company threatened a lawsuit (e.g., you sue me? I’ll sue you right back); or 2) to secure investment.

Over time, both of those rationales have proved to be false. First, owning a patent is no defense for a patent troll suit. Since a patent troll usually neither makes nor sells anything, it can’t be threatened with a lawsuit. Second, more and more investors report that they don’t care about their portfolio companies owning patents.

We think these broken rationales are proof of a patent system that has become unmoored. And recently we’ve been working hard to fix that through legislation -- you might have heard the news yesterday that the latest attempt at comprehensive patent reform died in the Senate.

This now leaves startups with a few bad choices: participate in the patent system and spend tens or hundreds of thousands of dollars (excluding the cost of enforcing those patents!), or don’t, but still find yourself facing lawsuits and other threats that come with sitting the system out.

So, together with EFF and OIN, we’re releasing a white paper prepared by Marta Belcher and John Casey from the Juelsgaard Intellectual Property Clinic at Stanford Law School. The paper is for startups and small businesses that want to understand some of their non-traditional licensing options. As we say in the paper:

“The traditional model of patent licensing—whereby a company pays a patent owner to license an invention that the company legitimately uses—has been hijacked by non-practicing entities (“patent trolls”) and other aggressive patent holders who assert overbroad patents that never should have been granted in the first place. Within this broken patent regime, companies are increasingly hacking the system—that is, finding alternatives to the traditional patent licensing model in order to both promote open innovation and protect the companies themselves. These patent system hacks can be organized into two broad categories: (1) defensive patent aggregators, which pool member companies’ resources to defensively purchase patents for the group and to fight patent trolls, and (2) patent pledges, whereby companies opt to openly and defensively license their patents to others.”

One example of an alternative is Twitter’s Innovators Patent Agreement (IPA). The IPA is simple: like most companies, Twitter asks its employees to assign their patents to the company. But, in exchange, Twitter promises it won’t use that patent to sue anyone, except for defensive purposes. Importantly, this promise travels with the patent, so even if Twitter sells it, the new owner cannot offensively sue without the permission of the original inventor. This kind of deal helps in hiring, since many software engineers scoff at software patents. It also helps Twitter’s brand, as a company that has taken a strong stand against a broken patent system.

This paper is intended as a guide to more solutions like this. Some might work for you, and some might not, but we think any commitment to patent defense is a step in the right direction.


The High-Tech Sector is Less Dynamic: Here's What That Means, and Why It Matters

Ian_Headshot_Horizontal.jpg

This post originally appeared in Harvard Business Review

Believe it or not, America’s high-tech sector has become less dynamic and less entrepreneurial in the last decade. That’s the key takeaway of a recent Kauffman Foundation report I co-authored.

Despite the fanfare this vital segment of the economy and its startups have received in recent years, the high-tech sector is experiencing a consolidation of activity away from young firms into more mature ones, and the pace of job creation has been on a persistent decline. While it’s true that high-tech companies have been well-represented among the fastest growing firms in the past few years, the high-tech sector--like the rest of the economy--is less dynamic overall.

What do I mean by “dynamic”? The study of business dynamism involves measuring the flows of firms and workers underlying the private economy. Businesses are constantly being formed, growing, shrinking, and closing. Labor markets reflect this churning: some jobs are created while others are destroyed, and some workers move into new roles as others seek to replace them. New and superior ideas replace existing and inferior ones, while more productive firms usurp less productive ones.

A particularly important part of this dynamic process is the entrepreneur, who starts a venture to create a new market, or to replace incumbents in an existing one. And entrepreneurs also play an outsized role in new job creation. While older and larger firms account for the substantial majority of employment levels, new and growing young firms drive net new job creation overall.

The process of business and labor market churning is a messy one. But it’s also fundamental to modern economies. Research has firmly established that this process of “creative destruction” fuels productivity growth, making it indispensable to our sustained economic prosperity. In other words, a more dynamic economy is a higher growth one.

But business dynamism is breaking down.

Forthcoming research from economists at the University of Maryland and the Census Bureau shows that business dynamism has been declining across a broad range of sectors during the last few decades--and the single biggest contributor is a declining entrepreneurship rate. A host of indicators point to a workforce that has become more risk-averse, and therefore less likely to change jobs or start a new venture.

I recently teamed up with two authors of the aforementioned research to produce the Kauffman report: John Haltiwanger of the University of Maryland, and Javier Miranda of the Census Bureau. We surveyed how these trends might apply to the high-tech sector. What we found surprised me.

Though the high-tech sector was particularly dynamic and entrepreneurial during the 1980s and 1990s--a period when the same was not true across a broad range of sectors--all that changed in the 2000s. The job creation rate (representing expanding firms) has been on a sharp decline since the beginning of the last decade, while the job destruction rate (representing contracting firms) has held about steady--squeezing net job growth in the process. By 2011, the rate of overall labor market churning in high-tech had converged with the rate for the total private sector.

Even more striking was the declining entrepreneurship. Young firms that I’ll call “startups”-- those aged five years or less--comprised 60 percent of all high-tech firms in 1982. That figure fell to 38 percent by 2011. About half of this decline took place after the dot-com bust dissipated. The decline in both entrepreneurship levels and rates during the period associated with the Great Recession were sharper in high-tech than for the rest of the economy.

A decline in high-tech dynamism might be particularly problematic for future growth. Aside from the direct impact on productivity in technology-adopting segments of the economy, the high-tech sector itself plays an outsized role in income, employment, and productivity growth overall. Of the job-creating young firms, high-tech startups are particularly dynamic--growing at twice the rate of a typical young business, and high-tech firms account for an outsized share of America’s fastest growing businesses--the so-called “gazelles.”

To be clear, our data were last collected in March 2011 and our definition of high-tech stretches beyond software and internet companies to include things like computer hardware, life sciences, and aerospace. Still, investments in early-stage firms haven’t exactly been explosive in the last two years, and the recent boom of high-value venture-backed exits--either through acquisition or IPO--were generally companies hatched long before our lapse in data. Market participants I talk to think my observation of an uptick in high-tech firm starts in 2011 accelerated in 2012 before plateauing in 2013. That appears consistent with one recent analysis of high-tech job growth.

This work may pose more questions than answers, but as economists are working to uncover these, we can be asking ourselves what we can do to promote technology entrepreneurship right now--which, although popular, may not actually be booming at the level the media would have you believe.

EU Tech Sector Growth Shows Similar Trends to US

Just as our earlier U.S. research pointed to the pervasive and substantial growth of the high-value, high-tech workforce across the country, new research on high-tech employment and wages in the European Union highlights many of the same trends. Overall, the research establishes the high-tech sector as an important source of employment, income, and economic growth during what has otherwise been a difficult economic period for much of the EU.

In the first report of its kind to focus on the EU high-tech sector, we reframed the way Europe should be thinking about high-tech workers, expanding the definition to include STEM workers in non-high tech industries alongside workers within high-tech firms. Here’s what we found:

High-Tech Workers Are Better-Off in the Labor Market

With low unemployment rates and significant wage premiums, it’s clear that Europe’s high-tech workers face substantially more favorable labor market outcomes than their non high-tech peers.

High-Tech Employment is Booming Across Europe

Between 2000 and 2011, high-tech employment grew 20 percent where total employment increased only by 8 percent. The result was that by 2011, Europe’s 22 million high-tech workers represented 10 percent of total employment.

EU-27 High-Tech Employment Share of Total

8-20 percent
8-20 percent

Mirroring a similar trend in the United States

The study also finds that high-tech employment is spread throughout the continent, reaching far beyond regions that are well-known tech hubs -- in fact increasing most in the areas with with previously lower concentrations of high-tech activity. So, geographically and economically diverse regions are benefiting from high-tech job creation--but that’s not all. There is also a sizable secondary local jobs multiplier, where the creation of one high-tech job in a region results in more than four additional non-high tech jobs in the same region.

High-Tech Local Jobs Multiplier

EUmultiplier
EUmultiplier

Delving into the idea that growth in high-tech employment is happening across Europe, here are some findings that might be surprising to some:

  • The Czech Republic had the highest concentration of high-tech workers in 2011 (13.7 percent of total employment).
  • Finland, Sweden, Denmark, France, and eight additional countries had high-tech employment shares above 10 percent of total employment in 2011 -- in other words, above the EU average.
  • Spain has doing well--at least through 2011. Spain’s rapid high-tech growth, combined with its large population, amounted to an increase of 441,000 high-tech workers between 2000 and 2011—fourth in the EU-27 behind France, Germany, and Italy.

Employment Change by Country and Sector

employment change
employment change

This report certainly makes the case for the impact of the high-tech economy in Europe. Still, we need a deeper understanding of the contributions of this sector by looking at other measures of economic vitality, such as entrepreneurship, economic output, research and development, and productivity. Then, as in the United States, we are still left with the only question that counts: why do high-tech companies start where they do, and how can we create a better environment in each of our backyards? Our report doesn’t answer those questions, but it does establish a comprehensive set of facts from which policy makers and other stakeholders can draw upon as various proposals for increasing growth and competitiveness in the European Union are considered.

Is America’s High-Tech Jobs Machine Slowing Down?

Is America’s High-Tech Jobs Machine Slowing Down?

The pace of high-tech employment growth has been on a steady decline over the past two years. Despite growing substantially faster than total employment coming out of the Great Recession, job growth in high-tech industries and STEM occupations has slowed to match the anemic pace of job growth across the economy as whole. It goes without saying that a decline in these high-value jobs is not a welcome development for the U.S. economy.

Engine Interview with Kansas Radio: Startup Research and Policy

Engine Interview with Kansas Radio: Startup Research and Policy

Engine's Research Director Ian Hathaway recently spoke with Jason Grill on Entrepreneur KC Radio on how high-tech startups create jobs. Referencing his recent research on the impact of startups on job creation and growth, Ian also specifically highlights the unique conditions that have led Kansas City to become a growing hub for tech entrepreneurship.

Engine On Air Episode 2: The Economic Impact of Startups

Engine On Air Episode 2: The Economic Impact of Startups

This summer, we released a new paper with the Kauffman Foundation that looks into the impact of high-tech startups on job creation and economic growth. To help us explore this issue, and the role policy can play in fostering growth, for this episode Mike McGeary is joined by Engine’s Research Director, Ian Hathaway, Dane Stangler, Director of Research and Policy for the Kauffman Foundation, Jim Franklin, CEO, and Tim Falls, Director of Developer Relations, from Boulder-based startup Sendgrid, and Robert Litan, Director of Research at Bloomberg Government.

California Rights Course on Small Business Tax

California Rights Course on Small Business Tax

California Governor Jerry Brown signed a new law that amounts to a big victory for startups and their investors. Assembly Bill No. 1412 reverses a 2012 adjustment that would have resulted in massive retroactive taxes on investors and small business owners. Engine’s estimate on the new rule's impact on startups empowered advocates looking to overturn the adjustment with a data-rich perspective on future investment, business, and employment growth.

All Over The Country, New and Young High-Tech Firms Are Key Job Creators

All Over The Country, New and Young High-Tech Firms Are Key Job Creators

All over the country, new and young businesses—as opposed to small businesses generally—play an outsized role in net job creation in the United States. But not all new businesses are the same—the majority of entrepreneurs to-be don't intend to grow their businesses or innovate. Differentiating growth-oriented “startups” from the rest of young businesses is an important distinction that we make in this latest paper. 

Are Startups Back?

Are Startups Back?

Is entrepreneurship everywhere, or is economic dynamism dead? With competing information afloat, that’s the question we sought to answer with newly-released Business Dynamics Statistics (BDS) data from the Census Bureau. We found a couple of things. First, as the U.S. economy belatedly recovered in 2011, so did business creation--the first time in five years. Second, this growth in new business formation was geographically dispersed throughout the United States.

It’s All Relative: STEM Workers are in High Demand

Recent claims of an excess supply of high-skilled workers in the STEM occupations of science, technology, engineering and math are at odds with anecdotal and empirical evidence. While it’s difficult to definitively conclude whether or not there is a shortage of workers in any field, publicly available government data and common sense reject the notion that there are “too many” high-tech workers in the United States. More importantly, this entire discussion misses a larger point—high-skilled employment isn’t a zero sum game where a fixed set of workers are competing for a fixed set of jobs in an economy free from global competition. Let’s separate fact from fiction as we move forward with immigration reform.

Background

As the immigration reform debate heats up, so too has the rhetoric. One issue that has generally received broad support is the idea of expanding visas for high-skilled foreign workers—in particular those in the STEM fields of science, technology, engineering and math. Such support is based on the view that there aren’t enough qualified native-born American workers to fill demand for these roles. It also comes from the acknowledgment that employment in these fields is critical to economic growth, making them a national priority.

Despite this, some critics have voiced concerns about expanding visas for STEM workers, arguing not only that there isn’t a shortage of STEM workers, but in fact there are too many of them. Expanding high-skilled work visas, they claim, would push native-born American workers out of key technological occupations and reduce the wages of those who remain in them. Such claims are certainly outside the mainstream, but they have been taken seriously enough to appear recently in the Op-Ed page of the New York Times, the Washington Post, the Wall Street Journal, and most recently, the Atlantic.

So, which is it? Are there too few or too many STEM workers in the United States? It can’t be both. Since the truth has important implications for thousands of workers, startups, and the economy, we had better get it right.

The “we have too many high-tech workers” hypothesis is flawed because it is informed by an incomplete set of information. It also lacks common sense. The aforementioned articles rely upon a November report and a report published last week by the same think-tank, both of which point to tepid inflation-adjusted wage growth in computer and math sciences (CMS) fields—a subset of STEM—as definitive evidence of an abundance of labor supply in those professions.

The fact that inflation-adjusted wages grew slowly during the last decade lacks important context. Quite obviously, there were two economic recessions during this period—one of which was the worst contraction since the Great Depression. Both were followed by “jobless recoveries,” or prolonged periods of low employment growth after the economy has begun to grow again.

At minimum, a more relevant question is: how did wages in the CMS fields, and by extension STEM, grow relative to other professions? Looking at just one side of the story is the intellectual equivalent of concluding that the Cincinnati Reds lost last night because they only scored 2 runs. They actually won, because the team they played, the St. Louis Cardinals, scored just 1 run. Context matters.

A more complete and responsible analysis would look at relative performance as well as a broader set of measures to determine labor market “tightness”—a term that applies to areas where potential shortages may exist. A tight labor market would have some or all of these qualities relative to others: rapid employment and wage growth, low unemployment, and a high prevalence of job vacancies.

One final note before we get started: because this debate is taking place in the context of immigration reform for high-skilled workers, whenever possible the data here will be restricted to workers with at least a bachelor’s degree.

Wage Growth

Economic theory says that if shortages existed, prices (wages) would adjust upward until supply (workers) met demand (employers). But the reality is much more complicated. For example, wages adjust slowly and workers must learn new skills—especially for technical roles like in STEM. Still, it’s an important measure for assessing labor market tightness.

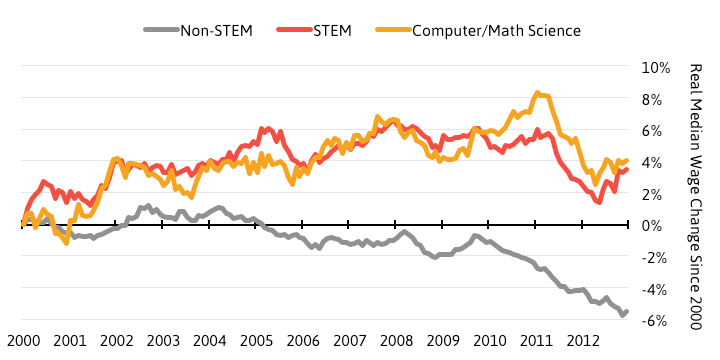
The chart below shows how the inflation-adjusted median wage has changed since January 2000 through 2012, for three groups of workers—those in the STEM occupations, those in the CMS subset of STEM, and those in all occupations outside of STEM.

Real Median Wage Change, Bachelor’s Degree Holders (2000-2012)
Wage change

Source: U.S. Census Bureau, Current Population Survey; Bureau of Labor Statistics, CPI; Engine calculations. Note: Data have been smoothed using a 12-month moving-average

The median wage in STEM and CMS occupations grew by an inflation-adjusted 3.5 percent and 4.0 percent respectively. That amounts to average annual growth rates of around one-third of a percent. Ouch.

But let’s take look at this in context: it’s been a very rough twelve years. As I mentioned before, there were two recessions—one of them the worst economic contraction since the Great Depression—followed by two jobless recoveries. The fact that there was wage growth at all during this period might actually be impressive.

Compared with workers in other fields, wage growth for STEM and CMS workers was actually quite robust. The inflation-adjusted median wage for all occupations outside of STEM fell by 5.5 percent during the same period, for a decline of half a percent each year on average.

Employment and Unemployment

Beyond wage growth, there are a few other measures to consider when analyzing labor market tightness—here we look at employment growth and the unemployment rate before turning to job vacancies afterward.

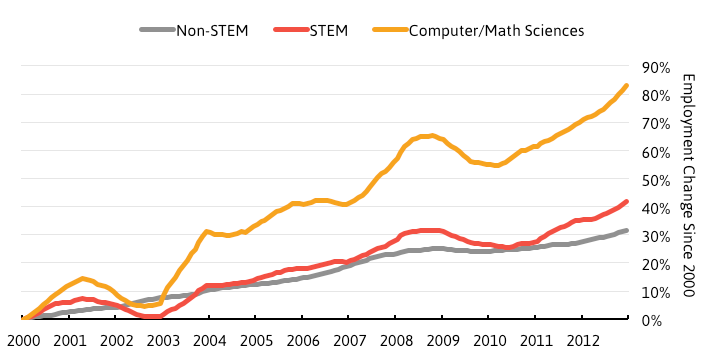
Employment Change, Bachelor’s Degree Holders (2000-2012)
Employment change

Source: U.S. Census Bureau, CPS; Engine calculations. Note: Data have been smoothed using a 12-month moving-average

This chart shows employment growth since January 2000 for college-educated workers in the STEM, CMS and non-STEM categories. Employment in the non-STEM occupations increased 31.3 percent, for an average annual gain of 2.3 percent. STEM fields performed even better, growing 41.6 percent or 2.9 percent per year on average—that’s about one-third more growth than non-STEM. The CMS subset blew the others away—more than doubling non-STEM growth as it increased by 83.1 percent or 5.2 percent annually on average.

Unemployment Rate, Bachelor’s Degree Holders (2000-2012)

unemployment rate

 Source: U.S. Census Bureau, CPS; Engine calculations. Note: Data have been smoothed using a 12-month moving-average

This chart shows the unemployment rate for each of our occupational groups during the same time period. The unemployment rate shows the number of people without a job, but who are willing and able to work, and are actively looking for a job (the unemployed), as a share of the total labor force (the unemployed plus the employed). In this case, the occupation assigned to an unemployed person would be the one they held in their last position.

As the chart shows, unemployment rates for college-educated workers of all varieties have been quite low over the last twelve years. The rate for STEM, and especially CMS workers, spiked during the dot-com boom—highlighting the job losses that occurred in that segment of the economy. Important to note, however, is that after peaking unemployment in STEM and CMS fell sharply. This indicates the ease with which unemployed workers in those fields were able to find new work—highlighting their relative value to employers.

The three rates peaked at about the same level during the Great Recession, though STEM and CMS unemployment has fallen sharply since mid-2010; declining by about 2.5 and 2.0 percentage points respectively during that two-year period. Unemployment for workers outside of STEM has only declined by about half a percentage point during the same period. Overall, the evidence here is more mixed: STEM workers seem to face higher volatility while unemployment for non-STEM workers rises less during recessions but also falls slower in recoveries. Even so, the STEM rate has fallen sharply in the last year.

Job Vacancies

Perhaps the most important measure for assessing labor market tightness is the ability of employers to fill open positions. If labor shortages exist, it would be difficult to fill open positions—openings would remain vacant for extended periods or discouraged employers may not even bother posting them at all. Since the reasons for not filling a job are complex, and even if they weren’t, data are elusive, the next best option is to compare the number of open positions with the number of workers available to fill them.

Here, we look at two ways of presenting that data. One caveat first—the job vacancy data used here aren’t available by level of educational attainment. Therefore, we are unable to restrict this portion of the analysis to workers with a bachelor’s degree or more. As a result, the differences here between STEM, CMS and non-STEM may be somewhat overstated.

Number of Unemployed per Job Opening (2005-2012)
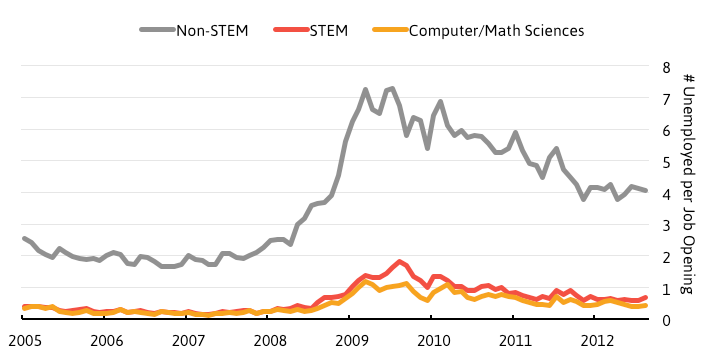
unemployed per opening

 Source: U.S. Census Bureau, CPS; Conference Board, HWOL; Bureau of Labor Statistics, JOLTS; Engine calculations

In a market with an abundance of available labor, the ratio of unemployed per job opening would be high—a large number of workers would be competing with one another for a smaller number of jobs. Where the labor market is tight, this number would be low—in other words demand is outstripping available supply. While the reality is more complicated, this is still a very good way to estimate the relationship between demand and supply.

As the data make clear, the market in STEM and CMS fields is much, much tighter than for fields outside of STEM. At the end of 2012, there were 2.4 CMS job openings for each unemployed CMS worker and 1.4 STEM openings for each unemployed STEM worker. That’s a lot of job openings for each unemployed worker to potentially be matched with. The exact opposite was true in non-STEM fields, where 4 unemployed workers battled for each job opening.

Job Vacancy Rate (2005-2012)

Job Vacancy

 Source: U.S. Census Bureau, CPS; Conference Board, HWOL; Bureau of Labor Statistics, JOLTS; Engine calculations

If you’re unconvinced that unemployed workers are an adequate measure of available labor, we can extend that definition to include workers who are currently employed in those roles. Recall that the unemployed plus the employed constitute the labor force. Here, we use the labor force as a measure of labor availability for STEM, CMS and non-STEM workers.

This time, the number of job openings is in the numerator and is expressed as a share of the labor force. This is often referred to as the job vacancy rate. Here, a bigger number would indicate a tighter labor market, showing that there are a larger number of job openings relative to the ability of the labor force to fill them. A smaller job vacancy rate would indicate the opposite.

We still see a similar story, though less pronounced: there is a larger number of job openings relative to available labor to fill those roles in STEM and CMS, compared with fields outside of STEM. The difference between this chart and the prior one likely has to do with a more rapidly declining unemployment rate and higher employment growth in STEM and CMS—both positive signs.

Conclusion

Wage growth for STEM and CMS workers with at least a bachelor’s degree has been more robust during the last twelve years than it has been for workers outside of these fields. Not only did wages grow at the median for these fields while wages in all other professions fell substantially, that growth also reached workers with a broader set of income levels.

Looking at other measures, available labor to meet job openings has been scarcer for the STEM and CMS fields, employment growth has been more robust, and unemployment has fallen to lower levels. The evidence is more mixed when it comes to unemployment, but overall the consistency across measures and the magnitude of differences point to tighter labor markets in these fields.

In fact, according to performance thresholds to assess labor market tightness outlined in a comprehensive review of the literature published by the Bureau of Labor Statistics, the CMS labor market is tight on each of three metrics (employment, wages, and unemployment). STEM is tight on two of three (wages and unemployment) and goes halfway on the third (employment). The BLS report doesn’t provide threshold criteria for job vacancies because these data weren’t available at that time.

This highlights a few important points worth making. Firstly, providing definitive evidence of the existence or nonexistence of a labor shortage in any profession is difficult, both because what constitutes a shortage can be broad based and because the appropriate data can be elusive. It’s irresponsible for researchers to claim there is an oversupply of STEM workers because of one metric taken outside of its proper context.

To be clear, the approach here does not claim that there is a shortage of workers in STEM and CMS fields. Instead, it shows that these labor markets are tighter than others based on a broad set of measures. At minimum, it is a clear rejection of the notion that we have too many high-tech workers in the United States—an argument that not only fails on evidence, but common sense as well.

Secondly, and perhaps most importantly, the argument about whether there is or is not a true shortage of STEM workers misses the entire point. Recent research has shown that foreign-born STEM workers increase employment and wage opportunities for high-skilled native-born American workers (STEM and non-STEM). In other words, these workers are complementary to, not substitutes for, one another. Foreign-born STEM workers are important contributors to productivity gains, which fuel economic growth and national prosperity. And because these workers tend to be employed in sectors of the economy that compete globally, if the United States doesn’t capture the talent and therefore growth, someone else will.

Let’s get our facts straight, and in context, as we move forward with immigration reform. Sure, foreign worker programs like the H-1B visa have a number of problems and need rethinking. So does our education system. But let’s fix those, not shut our doors to high-skilled foreign workers based on poor economics. That would be throwing the baby out with the bathwater, and in the process, shooting ourselves in the foot.

Ian Hathaway is the research director at Engine.

California Tax Change Will Hurt Entrepreneurs and Job Creation

CA-Private-Sector-Annual-Net-Job-Creation.png

The removal of a state tax incentive for investment in startups is likely to make capital scarcer for California companies most poised for high growth—harming job creation and an already vulnerable state economy in the process. The change breaks with current federal policy and puts California’s entrepreneurs at a relative disadvantage to those in other states. We estimate that investments in California’s startups will decline by a conservative 2 percent each year from the tax change—translating to a drop of at least $85-$127 million annually based on 2011 data.

In December, the California Franchise Tax Board (FTB) announced changes to capital gains tax exclusions on Qualified Small Business (QSB) stock holdings. The change stemmed from an appellate court ruling that found minimum in-state asset and employment requirements during the holding period of the QSB stock unlawful under the U.S. Commerce Clause. Rather than remove the in-state asset and employment threshold requirements, the FTB instead chose throw the baby out with the bathwater and eliminate the capital gains tax exclusions altogether—effectively increasing state taxes on investments held in QSBs from 4.65 percent (under a 50 percent exclusion) to 9.3 percent (under zero exclusion).

The real attention grabber has been the FTB’s choice to make the change retroactive to 2008—with penalties and interest—despite the fact that investors were following what was then current law. While investors are up in arms over this, entrepreneurs may actually have the most to lose moving forward. 

Capital is the lifeblood of startups. This move by the FTB, which amounts to a tax hike for investors, will likely make capital scarcer for young businesses. Fewer startups means less job growth; for the last 30 years, young companies have provided all of the net new job creation in California and the United States as a whole.

Matching an existing framework with data on California, it’s possible to generate a conservative, back-of-the envelope, estimate of investment startups in the state might lose. This drop would likely have a negative impact on the California economy—not only have startups been the engine of new job creation in the state, but the QSB capital gains tax exclusions were targeted especially at businesses with the highest growth potential.

Estimating Investment Impact of Tax Change

A 2012 Kauffman Foundation report provides the framework for estimating the impact of tax changes on early-stage investments in startups. The report yields a conservative estimate of the additional investment in startups that would occur if 100 percent of the capital gains held at least five years were excludable from federal taxation, compared with an earlier exclusion of 50 percent. In other words, the report tells us how much investments of this nature might increase when taxes are reduced.

We employ that same framework here but move in the opposite direction, answering the question: how much would investments in startups decline from what amounts to a tax increase? Then we apply this estimate to data on investments in California startups.

Let’s unpack the potential investment response to the tax increase by using a hypothetical example. The Kauffman report states that a reasonable assumption for a real pre-tax return on privately held investments in startups in the current interest rate environment is 10 percent. At least one prominent angel investor group agrees, and so do we. 

Under this assumption, an investment of $100 would be worth $161 after five years on a pre-tax basis. If the tax rate were 4.65 percent, as it was under the previous 50 percent exclusion in California, that same investment would be worth $158, for an average annual return of 9.6 percent. Under a 9.3 percent tax rate regime (zero exclusion), that same investment would be worth $155—returning 9.2 percent per year on average. Capital gains in QSBs are currently fully excludable from federal income taxes and were in 2011 as well—the base year used in our analysis.

A change in the effective tax from 4.65 to 9.3 percent results in a 4 percent drop in the average annual return on the investment (from 9.6 percent to 9.2 percent). Based on previous research on the topic, and conversations with experts in the field, the Kauffman report concluded that the responsiveness (the “elasticity”) of such a change in the rate of return on aggregate investments is a conservative 0.5—or half the change in return. In other words, the 4 percent decline in a typical return would result in a 2 percent drop in investment overall. Two percent may not seem like a big decrease, but when applied to a large base like in California, it can be.

To see how big of a dent 2 percent could make, the baseline estimate of equity invested in California startups is tabulated from three sources of “seed funding”:

Seed-Stage Investments in California Startups (2011)

Source of funding $ (in Billions)
Venture capital $0.5
Angel investors $2.8-$4.4
Entrepreneurs' equity     $0.8-$1.2
Total $4.1-$6.1
 Sources: PricewaterhouseCoopers MoneyTree, Center for Venture Research, Silicon Valley Bank, Kauffman Foundation; Engine calculations

In total, an estimated $4.1-6.1 billion was invested in California seed-stage startups in 2011. It is reasonable to assume that essentially all of these seed funds were invested in traditional C corporations—the type of company that is most suitable for startups and is eligible for the QSB tax deduction. For scope, that amounts to between 32 and 47 percent of such investments in the entire United States.

With a baseline of $4.1-6.1 billion, and a 2 percent reduction in investments from the tax change, we’re left with a decline of $85-127 million in investment in startups each year in California. Now, $85-127 million per year may not sound like a whole lot of money relative to total investments in startups broadly, but over ten years it totals between $853 million and $1.27 billion. Moreover, whether we are talking about an annual or decade-long framework, considering that seed-stage companies may receive as little as $15,000 in funding (though a typical amount is in the hundreds of thousands), we’re talking about a lot of companies that may be adversely affected.

What’s more, this is almost certainly an underestimate of the value of investments in California startups and the effect the tax change would have. To begin, the Kauffman report reiterates that its framework is likely to yield conservative estimates. Most notably, it states that the elasticity estimate of 0.5 is likely conservative—meaning that for each 1 percent decline in a typical rate of return, overall investments would fall by more than 0.5 percent.

Secondly, since QSB status in California applies to companies with up to $50 million in assets, many businesses beyond the “seed/startup stage” would qualify. As a result, we are surely undercounting the pool of investment in the state that would be affected by the tax change.

Third, the 2011 statutory state tax rate applied here (9.3 percent) is lower than the marginal rate charged to those with incomes above $1M (10.3 percent), which would apply to a non-trivial number of investors in startups. These investors would be adversely affected even more than our rough estimates indicate.

Finally, the Kauffman framework was previously applied to federal tax—which would be applied uniformly across states. Holding federal tax rates and all other factors constant, other states would have an advantage against California. According to the Angel Capital Association, twenty states have tax incentives for angel investors and California isn’t one of them. For example, states like Wisconsin are actively partnering with investors to increase investments in startups.

In addition to all of this, Proposition 30, which was adopted by California voters in November, raises state income taxes to varying degrees on individuals who earn more than $250,000 per year. Though this is outside the scope of our analysis—both because the year studied pre-dates that particular tax hike and because arguing the merits of state tax policy broadly goes beyond what we’d like to accomplish here—it will further compound the issue, potentially leading to even more declines in investments in California startups.

Economic Impact

Though data are not readily available to directly tie investments in QSB-type businesses specifically to the economic impact in California, data from the Census Bureau can illustrate the important role that new businesses play in job creation in the state.

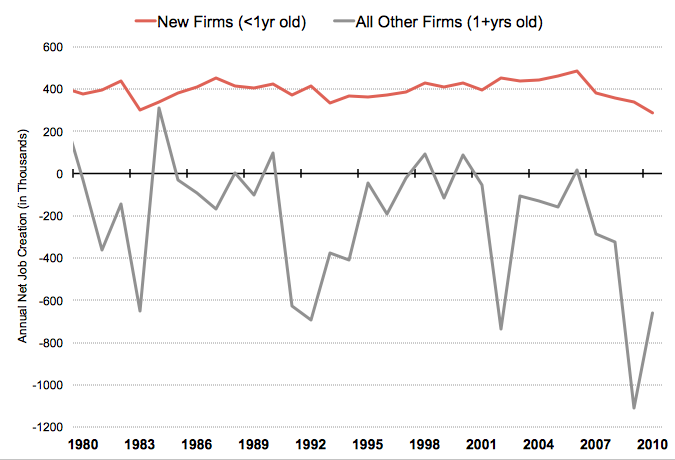
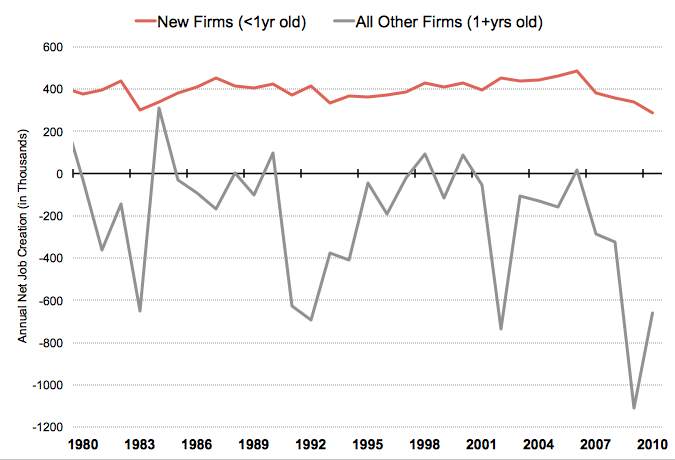
California Private-Sector Annual Net Job Creation by Firm Age (1980-2010)

CA Private Sector Annual Net Job Creation 

Source: U.S. Census Bureau, Business Dynamics Statistics

Between 1980 and 2010, businesses in their first year added an average of 398,193 new jobs each year. Companies aged one year or more, as a group, subtracted an average of 192,501 each year during that same period. This occurred because the forces of job destruction (through business contractions and closures) were stronger than the forces of job creation (through firm births and expansions) for businesses older than a year old as a group. In other words, outside of startups, net job creation in California was negative during the past three decades.

In addition to the job creation dynamics of new firms, among existing businesses it is young firms (those less than five years old) that have the biggest effect on job creation. Taken together with the chart above, we can say that new and young firms are responsible for all net new job creation during the past few decades.

Conclusion

The FTB’s tax change is likely to reduce investments in California’s startups by a conservative 2 percent each year, translating to $85-$127 million fewer investments annually based on 2011 data. This can’t be a good thing for the economy or job creation in the state. At a time when the state unemployment rate hovers around 10 percent, California can hardly afford to place any of its companies at a competitive disadvantage—especially not those poised for high growth. On top of that, a recent survey of small businesses sponsored by the Kauffman Foundation found California to be among the least friendly for entrepreneurs

Though it is understandable that state authorities are searching for ways to improve the fiscal situation of California, this isn’t a good way to go about it. The entire point of providing a tax incentive for these investments is to make them more attractive to investors, relative to others, precisely because seed-stage investments are very risky and because startups have important spillovers to the economy—namely that they fuel economic growth and job creation.

Moving forward, not only should state policymakers reinstate the QSB capital gains exclusion, they should extend it—making capital gains on these investments fully excludable. There is already precedent for this at the federal level too: in 2010 Congress temporarily made these investments fully excludable and recently extended this policy through 2013. If Washington can see the wisdom in doing this, why can’t Sacramento?

Ian Hathaway is the research director at Engine

Tech America: The Spaces Where Entrepreneurs Start Up

If you’ve read Technology Works, the report commissioned by Engine Advocacy and published last Thursday, 6th December, you know the importance of startups and entrepreneurship in getting America’s economy back on track. Despite America’s status as a great place for businesses, launching a startup is a difficult task. Incubators and accelerators are organizations that make that process a bit easier, and are a crucial ingredient in the country’s future economic prosperity.

So where are these entrepreneurial instigators? No doubt you’ve heard about Y Combinator, Tech Stars, and other well-known programs. And we all know about the great things happening in Silicon Valley, Silicon Alley, and the hotspots of Austin, Texas or Boston, Massachusetts.
But you may be surprised to learn that incubators and accelerators, like the startups they support and cultivate, are all over the country - from Groundwork Labs in Durham, North Carolina and the Manoa Innovation Center in Honolulu, Hawaii, to UpTech, an accelerator located in Newport, Kentucky.

Some incubators are founded by technologists, like 8ninths in Seattle, Washington, while some are launched by universities, such as Ohio University’s Innovation Engine Accelerator. Still others are formed by major companies, like Microsoft, PayPal, and Qualcomm, who want to stimulate the next generation of technology leaders.

Back in September, with the help of Engine, the Ammori Group put together a map based on startup incubators and accelerators across the country. Our goal was to develop a way for entrepreneurs, incubator leaders, and policymakers - everyone, really - to see where the incubators are, to learn about what they’re doing, and to get involved.

If your incubator or accelerator isn’t on the map, let us know by submitting your information. If it is on the map, feel free to update your information and tell us about your experiences. And please, share this with your colleagues, friends, and anyone interested in seeing where innovation is happening in America today.

Luke Pelican is an associate at The Ammori Group

Technology Works for Startups and Our Economy

TechWorksMap.png

We are proud to announce the launch of Technology Works today, a study demonstrating the pervasive and important growth of the tech workforce across the United States. Engine is committed to tracking the close connection between innovation and entrepreneurship. This new research, which we commissioned from the Bay Area Council Economic Institute, demonstrates the connection between high tech employment and overall economic prosperity.

Today’s study is an expansion on the data visualization we launched during the party nominating conventions that illustrates the geographically diverse nature of technology hubs in the U.S.

More than ever, startups harness technology to achieve their goals. This means hiring more people with skills in the science, technology, engineering, and mathematics (STEM) fields, the definitive factor in the Bureau of Labor Statistics’ defintion of high tech industries. Tech-focused startups tend to start small and grow rapidly, becoming the drivers of overall employment.

It’s easy to highlight startup success stories: Google, Facebook, Pandora, Twitter, and Yelp are just a few of the relatively young, tech-based companies that employ thousands of workers. As we better understand the multiplicative effects of hiring at these companies -- and the startups that will follow in their footsteps -- the case for supporting innovative entrepreneurs becomes apparent.

Communities experience significant benefits from high tech employment. We are able to estimate that the creation of one high tech job accounts for the creation of 4.3 other jobs in a local economy. How does that work? Technology workers tend to earn more than their peers in other industries, which they put back into the local economy by consuming goods and services. Tech companies companies also rely on local services and vendors, further driving local benefits.

So while many Americans may never work for a company like Google or a technology-focused startup, they still benefit from the impact these jobs have in communities around the country. About two-thirds of the U.S. labor force works in local services, ranging from healthcare to legal services to restaurants. As Enrico Moretti, Professor of Economics at the University of California, Berkeley, said about the study, “the dynamism of the US high tech companies matters not just to scientists, software engineers, and stockholders, but to the community at large.”

Our research with BACEI makes it clear that the economy increasingly depends on innovation. Explosive job growth isn’t likely to come from the established internet giants. It will bloom from driven entrepreneurs making the most of the technologies at their fingertips. Engine is committed to continuing analyses of startups’ impact on the economy and we’re planning further compelling research in the near future.

Put Your Mark on Our Innovation Map

Screen Shot 2012 09 26 At 6.01.01 PmA few weeks back, we posted the first version of a simple tool to connect startups to incubators and accelerators in their communities. Created in association with our friends Luke Pelican and Marvin Ammori, we’re aiming to build out the map further. We’re looking to you -- investors, mentors, and entrepreneurs -- to tell us where these innovation hubs are to better connect with entrepreneurs.

Startups are critical to economic growth and job creation. Connecting entrepreneurs to resources that will help grow their businesses will be critical to keep this trend going. By submitting information about your group, startups can more easily find the spaces that will help them thrive.

How does it work? Go fill out this survey and we’ll populate your information on our map (we’re a bit obsessed with maps lately). Before we do so, we’ll send a confirmation email to make sure you’re cool with being included. Then sit back and watch as your incubator or accelerator pops up on our map.

Simple, right? As adoption grows, we hope to build out and design this map into a more robust tool, but first we need the data from you to make it possible. So drop us a line and we’ll get back to you straight away. The country can’t wait for more startups to take off and you may be the group that mentors the next big startup success story.

Mapping Innovation and Entrepreneurship

Screen Shot 2012 09 26 At 6.01.01 PmStartups are flourishing across the country as we can see from the interactive map Engine released last month. What you may not know is that a network of incubators, accelerators, and other resources are available to entrepreneurs in these communities. Along with my colleague Marvin Ammori, we undertook a research project to catalog some of the important innovation hubs. With the help of our friends at Engine, we now have a tool to map these hubs for the benefit of entrepreneurs, job seekers, and policy makers. We welcome your help in continuing to build out this map for startups around the country.     

Startups are important: they drive economic growth and technological innovation, representing the best of entrepreneurialism and perseverance. However, finding assistance when launching a startup and building a business can be very difficult. Fortunately, there are organizations that help entrepreneurs turn a kernel of an idea into a thriving business: incubators and accelerators. These innovation spaces are a crucial ingredient for entrepreneurial success.

Generally speaking, incubators provide entrepreneurs with a place to set up shop, business resources, seed funding, networking opportunities, and other tools to get their companies started. Accelerators are similar in that they provide resources to young companies, but they also work with startups that are more established and help them to take their business to the next level. Together, these organizations play a critical role in the innovation ecosystem.

With Engine, we’ve created a map of incubators and accelerators that are helping startups throughout the country. Click on a pin to learn more about an individual innovation space. We show organizations that work with internet-focused companies -- app developers, software designers, and other related organizations -- but they may also host many other types of businesses.

The maps shows the innovation spaces that exist from coast-to-coast, in all 50 states. If you’re a startup looking for help launching or growing your technology company, check out the incubators and accelerators in your region. If you’re an incubator or accelerator but don’t see yourself on the map, fill in your information so we can add you.

Innovation Spaces Map

Survey  

Luke Pelican is an associate at The Ammori Group

Innovative U.S. Jobs, Startups Not Only a “Tech Center” Phenomenon

Screen Shot 2012 08 28 At 9.05.37 Pm

The tech sector may be driving the economy where you least expect. Today, in collaboration with the Bay Area Council Economic Institute, or BACEI, Engine launches its first major research project, demonstrating the importance of technology and entrepreneurship across the American economy. We invite you to explore the data and see where innovation is happening

Engine is San Francisco-based and we hear from people in business and government alike that startups and technology are centered in Silicon Valley, where a small network of innovators, investors, and entrepreneurs build the “new economy.” But in Engine’s effort to connect policymakers to entrepreneurs, we have worked with startups located across the country ranging from Kansas to Georgia to Michigan.

Our work with BACEI aims to tell the whole story. Using data from the Bureau of Labor Statistics and the National Establishment Time Series Database, BACEI calculations show that tech jobs and startups aren’t isolated. In fact, as BACEI economist Ian Hathaway told us last week, growth “is not only a ‘tech center’ phenomenon.” Communities including Dayton, Ohio and Troy, Michigan, and Columbia, South Carolina have experienced growth in technology employment exceeding 10 percent in 2011.

What BACEI observed:

  • Since the dot-com bust, jobs in the high-tech sector have performed better than for the private sector as a whole. 
  • A minimum of 61% of counties had at least some high-tech jobs in 2011 -- data limitations prevent a truer and larger estimate because data are suppressed in sparsely populated counties to protect the identity of individual companies. Estimates for many counties are not available.
  • Metro areas with the fastest growing high-tech jobs are geographically and economically diverse.
  • In 2009, more than 72% of counties had at least one new business establishment in the high-tech sector.
  • High-tech startups have held relatively steady during the economic downturn, even while new business establishments across the entire private sector have declined.

Let’s unpack this a little bit. Based on Department of Labor definitions, technology industries are those that include a very high share of technical disciplines -- those in science, technology, engineering, and mathematics fields (STEM). If you’ve been following Engine, you’ll know STEM employees play a critical role in startups and technology and that the need for STEM professionals has led to calls for new legislation to bolster startups.

Second, our data visualization tracks jobs in the private sector. This means we’re looking at all the jobs at companies in technology industries, not just workers with these professional skills. These industries include computer hardware, software, systems design, and information; high-technology communications and electronics equipment; internet publishing and web search portals; data hosting and processing services; pharmaceutical and medical manufacturing; aerospace manufacturing; architecture and engineering services; and research and development services. We aim to show that technology doesn’t just create jobs for engineers and computer scientists, but managers, designers, salespeople, and executives as well.

Finally, the startup data we track reflects new business establishments -- first-year startups -- in the same technology industries. This includes businesses across the board, including sole proprietorships that are not captured by Labor Department or Census Bureau data. It’s a broad net and captures a comprehensive picture of tech startup growth.

Our research aims to think critically about how technology, the internet, and entrepreneurship shape our economy. The first step is to dispel a few misconceptions about the location of tech jobs. Going forward, the analysis will provide insight into labor trends and their impact on public policy.

We want consumers, entrepreneurs, and policymakers to dive into the data -- looking at their own backyard or at the national level -- to gain a better understanding of how technology influences jobs. We think you might be surprised.